

In an increasingly data-driven world, geography provides a powerful framework for understanding complex patterns, uncovering hidden relationships, and predicting future outcomes. At the heart of this discipline lies Spatial Analysis in ArcGIS, an enterprise-grade capability that transforms static spatial data into actionable intelligence. Whether you are an urban planner evaluating housing development sites, an environmental scientist tracking wildlife corridors, or a business analyst assessing commercial real estate opportunities, spatial analysis empowers you to move far beyond basic mapping.
This beginners guide to spatial analysis in ArcGIS provides a thorough, professional foundation for understanding how location intelligence works. In this comprehensive resource, we will explore the fundamental concepts, core tools, advanced statistical methodologies, step-by-step analytical workflows, and industry applications that make ArcGIS the global standard for spatial problem-solving.
Table of Contents
What is Spatial Analysis in ArcGIS?
Spatial analysis is the quantitative and qualitative process of examining the locations, attributes, and relationships of geographic features. Rather than simply asking “where are things located?”, Spatial Analysis in ArcGIS enables users to answer far more sophisticated questions: “Why are things located where they are?”, “How do spatial features interact over space and time?”, and “What will happen at a specific location if conditions change?”
Modern Geographic Information Systems (GIS) integrate geographic location with structured tabular data. ArcGIS—developed by Esri—provides a rich ecosystem of geoprocessing tools designed to evaluate spatial distributions, calculate distances, model spatial interactions, and generate predictive surfaces.
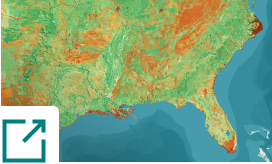
The Dimensions of Spatial Intelligence
To effectively perform spatial analysis, practitioners analyze five primary geographic dimensions:
- Location and Distance: Measuring absolute position, proximity, route optimization, and travel cost.
- Spatial Distribution: Identifying clusters, dispersed patterns, or orientation within geographic points or shapes.
- Spatial Relationships: Analyzing overlay, containment, intersection, and adjacency between different data layers.
- Surface and Elevation Modeling: Characterizing terrain properties such as slope, aspect, curvature, and continuous elevation surfaces.
- Spatial Change Over Time: Tracking dynamic processes like urban sprawl, deforestation, or weather movements over distinct temporal intervals.
By leveraging ArcGIS Pro spatial tools, analysts transform raw vector and raster datasets into meaningful spatial insights that drive executive decision-making.
Core Geoprocessing Tools and Analytical Categories
Every analytical project relies on a foundational set of operations known as geoprocessing tools. In ArcGIS Pro and ArcGIS Enterprise, these tools are categorized based on the spatial operational mechanics they execute.
Vector and Raster Analysis
Geographic data is broadly divided into vector (points, lines, and polygons) and raster (grids of cell values) formats. Understanding vector and raster analysis is critical for selecting the correct toolsets.
- Vector Analysis: Focuses on discrete, distinct entities with clear boundaries—such as property parcels, road networks, or water wells. Vector operations prioritize precise geometric relationships.
- Raster Analysis: Focuses on continuous phenomena—such as continuous temperature surfaces, digital elevation models (DEMs), or satellite imagery. Raster analytical engines evaluate grid cell matrices using mathematical operations known as Map Algebra.
Proximity and Buffer Zone Analysis
Proximity tools determine the spatial distance between features. The primary foundation of proximity measurement is buffer zone analysis, which generates defined geometric polygons around points, lines, or polygons at specified distances.
Key proximity tools in ArcGIS include:
- Buffer Tool: Creates equal or variable-distance polygon zones around features to identify areas of influence or restriction.
- Near Tool: Calculates the exact straight-line (Euclidean) distance and directions to the closest feature within a targeted layer.
- Distance Accumulation and Allocation: Evaluates true surface distance, accounting for terrain slope, physical barriers, and movement friction across complex raster surfaces.
- Network Analyst: Calculates real-world travel distance along constrained linear network systems, accounting for traffic, speed limits, turn restrictions, and localized impedance.
Overlay Analysis and Map Algebra
Overlay analysis combines multiple spatial datasets to evaluate geographic relationships across layered phenomena.
- Intersect: Outputs only the shared spatial overlap where input features intersect, maintaining attribute data from all layers.
- Union: Combines all spatial extents and tabular attributes from input polygon layers into a unified output coverage.
- Erase: Clears portions of an input layer that overlap with defined boundary masks.
- Raster Calculator: Executes powerful single-line or multi-line Map Algebra expressions to combine continuous raster grids based on logical conditional operators.
Advanced Spatial Statistics Tools and Machine Learning
Traditional GIS relies on deterministic geometric operations. Modern GIS spatial modeling integrates inferential statistics and spatial machine learning to quantify patterns scientifically.
Spatial Autocorrelation and Spatial Statistics Tools
Standard statistical methods assume that observational data points are independent of one another. Geographic data, however, violates this assumption due to Tobler’s First Law of Geography: “Everything is related to everything else, but near things are more related than distant things.” ArcGIS offers dedicated spatial statistics tools designed to explicitly evaluate spatial dependence.
Spatial Autocorrelation (Global Moran’s I)
Global Moran’s I measures whether a set of spatial features and their associated numerical attributes are clustered, dispersed, or random across an entire study area.
- Positive Autocorrelation: Similar attribute values (highs near highs, lows near lows) cluster together.
- Negative Autocorrelation: Dissimilar values arrange adjacently (a checkerboard pattern).
- Random: Attribute values show no spatial structure.
Hot Spot Analysis (Getis-Ord Gi*)
While Global Moran’s I evaluates overall patterns, Hot spot analysis identifies statistically significant local clusters of high values (hot spots) and low values (cold spots). The Getis-Ord Gi* statistic calculates a Z-score and p-value for each feature by comparing its local sum against the global average of surrounding neighbors. This functionality is essential for crime analytics, disease surveillance, and commercial real estate market assessment.
Cluster and Outlier Analysis (Anselin Local Moran’s I)
This tool pinpoints individual spatial anomalies—specifically highlighting high values surrounded predominantly by low values (High-Low outliers) or low values surrounded by high values (Low-High outliers).
Spatial Machine Learning and Predictive Modeling
ArcGIS incorporates sophisticated artificial intelligence (AI) and machine learning frameworks tailored specifically to handle spatial datasets:
- Density-Based Clustering: Identifies natural spatial clusters within point data based on spatial distribution and local point concentration, automatically filtering out background noise.
- Forest-based Classification and Regression: An adaptation of the Random Forest machine learning algorithm that builds predictive models using geographic covariates to forecast numerical values or categorical variables.
- Empirical Bayesian Kriging (EBK): An advanced geostatistical interpolation technique that automatically automates parameter estimation to build continuous prediction surfaces from sampled spatial points.
Practical Guide: How to Perform Spatial Analysis in ArcGIS Pro
Executing successful spatial projects requires an organized methodological approach. Below is a step-by-step workflow detailing how to perform spatial analysis in ArcGIS Pro effectively.
+-------------------------------------------------------------------------+
|                    SIX-STEP SPATIAL ANALYSIS WORKFLOW                   |
+-------------------------------------------------------------------------+
| 1. Frame the Question    -->  Formulate clear research objectives       |
| 2. Prepare Data          -->  Clean, project, and validate GIS inputs    |
| 3. Select Toolsets       -->  Choose vector, raster, or statistical tools|
| 4. Execute Analysis      -->  Run geoprocessing models & suitability maps|
| 5. Validate Results      -->  Check statistical metrics and accuracy    |
| 6. Visualize & Share     -->  Publish maps, dashboards, and reports     |
+-------------------------------------------------------------------------+
Step 1: Frame the Spatial Question
Begin by defining explicit, measurable objectives. Avoid vague goals like “analyze park land.” Instead, frame precise questions: “Which parcels within a 15-minute drive of urban centers meet environmental criteria for public park allocation?”
Step 2: Acquire and Prepare GIS Data
Collect relevant vector layers and raster grids. Ensure all datasets adhere to consistent data standards:
- Coordinate System Alignment: Verify that all layers share the identical Projected Coordinate System (PCS) suitable for your local study area to avoid severe spatial measurement errors.
- Topology and Data Cleaning: Clean geometry errors, eliminate duplicate vertices, and ensure missing attribute fields are properly addressed.
Step 3: Choose the Geoprocessing Framework
Determine whether your research question requires proximity routines, overlay combination tools, geostatistical interpolation, or suitability modeling.
Step 4: Execute Suitability Modeling
When finding optimal locations, suitability modeling combines disparate layers into a unified decision matrix:
- Reclassify Datasets: Convert diverse physical measurements (such as distance to roads, slope percentage, and land cover type) into standardized numeric scales (e.g., 1 to 10 scale).
- Assign Weights: Apply importance weighting to each input criterion based on expert consensus or statistical validation.
- Combine Layers: Aggregate weighted criteria using tools like Weighted Overlay or the Suitability Modeler in ArcGIS Pro.
Step 5: Validate and Interpret Analytical Output
Critically examine the geoprocessing outputs. Review statistical significance metrics (p-values, Z-scores, R-squared values), check sensitivity parameters, and evaluate whether outputs mirror real-world ground conditions.
Step 6: Visualize and Communicate Results
Translate abstract numerical outputs into clean cartographic visuals, interactive web dashboards, or formal technical reports tailored to technical and non-technical stakeholders.
Real-World Applications Across Key Industries
The real-value execution of Spatial Analysis in ArcGIS spans across dozens of commercial, public, and environmental sectors.
Urban Planning and Smart Cities
City planners utilize overlay analysis and network models to identify underserved transportation corridors, project urban growth boundaries, model solar panel energy potential across building rooftops, and optimize emergency service dispatch routes.
Environmental Conservation and Natural Resources
Ecologists rely on suitability modeling and interpolation to map endangered species habitats, model wildfire propagation velocity based on terrain slope and wind speed, monitor coastal erosion, and calculate watershed drainage basins.
Commercial Real Estate and Retail Site Selection
Business intelligence analysts utilize buffer zone analysis, drive-time service areas, and hot spot analysis to evaluate local demographics, pinpoint high-performing retail locations, define commercial trade zones, and assess competitor density.
Public Health and Epidemiology
Public health agencies leverage spatial autocorrelation and spatial statistics tools to map disease transmission vectors, evaluate environmental contamination exposure, and optimize hospital capacity distribution during health emergencies.
Best Spatial Analysis Workflows for GIS Professionals
Developing repeatable, scalable analytical routines is essential for maximizing efficiency and maintaining accuracy. Below are best spatial analysis workflows for GIS professionals seeking to streamline operations.
Automating Tasks with ModelBuilder
ModelBuilder in ArcGIS Pro provides a visual programming canvas to chain geoprocessing tools into dynamic visual workflows. Building visual models allows analysts to:
- Automate repetitive, multi-step analytical pipelines.
- Easily modify parameter inputs without re-running individual tools manually.
- Document processing logic clearly for team collaboration and auditing.
Scripting Advanced Workflows with ArcPy
For high-level automation, GIS professionals write Python scripts utilizing Esri’s arcpy site-package. Scripting allows users to automate batch processing of massive spatial databases, integrate machine learning libraries (such as scikit-learn, TensorFlow, or PyTorch), and execute automated scheduled reports.
Key Best Practices Summary
- Maintain Metadatabase Integrity: Document processing lineage, source references, and attribute definitions.
- Optimize Spatial Indexing: Build spatial indexes on enterprise geodatabases to improve query speed on large vector layers.
- Leverage Cloud Processing: Utilize ArcGIS Image Server and ArcGIS Analytics for IoT to analyze massive raster grids and real-time streaming spatial data at scale.
Conclusion
Spatial Analysis in ArcGIS converts raw location data into actionable geographic insight. By mastering everything from basic buffer zone analysis and overlay operations to complex spatial statistics tools and machine learning workflows, spatial analysts gain the power to solve critical real-world challenges with scientific precision.
Whether you are designing sustainable urban infrastructure, protecting natural ecosystems, or identifying trade area potential, applying location intelligence through ArcGIS Pro spatial tools ensures robust, data-backed decision-making. Continue exploring toolsets, automating multi-step routines with ModelBuilder, and leveraging advanced geostatistical techniques to maximize the power of your GIS spatial modeling projects.